Overall Campus Placement for Past five years: 2019-20 to 2023-24
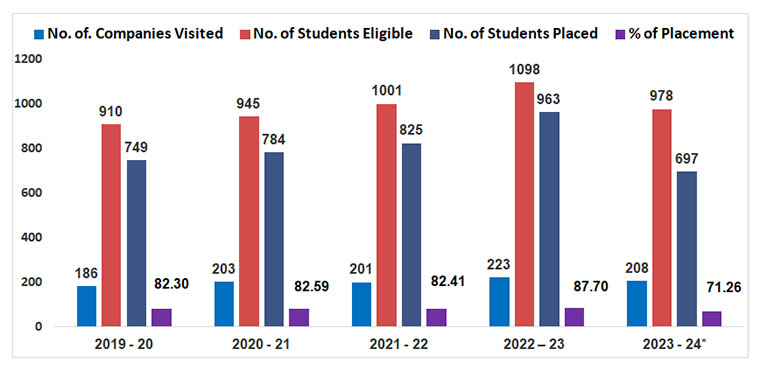
| YEAR | No. of. Companies Visited | No. of Students Eligible | No. of Students Placed | % of Placement |
| 2019 – 20 | 186 | 910 | 749 | 82.30 % |
| 2020 – 21 | 203 | 945 | 784 | 82.59 % |
| 2021 – 22 | 201 | 1001 | 825 | 82.41 % |
| 2022 – 23 | 223 | 1098 | 963 | 87.70 % |
| 2023 – 24* | 208 # | 978 | 697 | 71.26 % |
* – Recruitment process still in progress
# – Result awaited few more companies
Core / IT & ITES Company visited for campus placement from 2020 to 2024
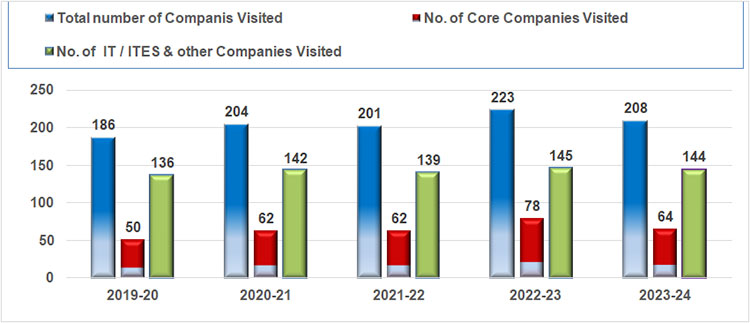
| Year | Total number of Companies Visited | No. of Core Companies Visited | No. of IT / ITES & other Companies Visited |
| 2023-24 * | 208 * | 64 | 144 |
| 2022-23 | 223 | 78 | 145 |
| 2021-22 | 201 | 62 | 139 |
| 2020-21 | 204 | 62 | 142 |
| 2019-20 | 186 | 50 | 136 |
* – Placement in progress