Placement Statistics
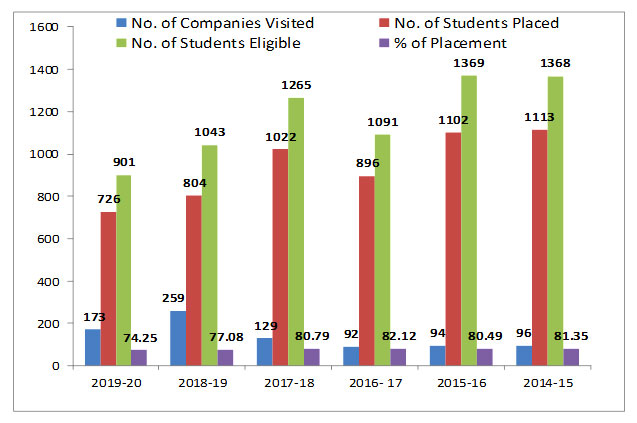
Overall Campus Placement for past Six years
| Year | No. of. Companies Visited | No. of Students Placed | No. of Students Eligible | % of Placement |
|---|---|---|---|---|
| 2019 – 20* | 173* | 726* | 901* | 80.57%* |
| 2018 – 19 | 259 | 804 | 1043 | 77.08% |
| 2017 – 18 | 129 | 1022 | 1265 | 80.79 % |
| 2016 – 17 | 92 | 896 | 1091 | 82.12 % |
| 2015 – 16 | 94 | 1102 | 1369 | 80.49% |
| 2014 – 15 | 96 | 1113 | 1368 | 81.35% |
* Recruitment still in progress through online