
Crescent Sustainability Initiatives
CLEAN WATER AND SANITATION (SDG 6)
WATER REUSE MEASUREMENT AT THE UNIVERSITY
The university has implemented a robust water reuse strategy, demonstrating a commitment to sustainability and efficient resource management. The total wastewater generated from the sewage treatment plant (STP) is approximately 29,461 cubic meters per year.
This water is recycled for various beneficial purposes, significantly reducing the demand for fresh water. The university’s approach aligns with the definition of water reuse, which involves recycling treated wastewater for applications such as irrigation, industrial processes, and toilet flushing.
BREAKDOWN OF RECYCLED WATER USAGE
The recycled water is allocated across different uses, with 85% designated for landscaping, 10% for toilet flushing, and 5% for housekeeping. This strategic allocation highlights the university’s focus on maximizing the utility of recycled water in areas that can significantly benefit from it. For instance, using treated wastewater for landscaping not only conserves fresh water but also supports the maintenance of green spaces on campus, enhancing the overall environment for students and staff.
MONTHLY WATER REUSE DATA
The monthly data from June 2022 to December 2023 illustrates the university’s ongoing efforts in water recycling. Each month, the quantity of recycled water varies, reflecting seasonal changes and water usage patterns. For example, in March 2023, the university recycled 1,899 cubic meters of water, showcasing a peak in water reuse efforts. The total treated water over the period indicates a consistent commitment to recycling, with a total of 27,734 cubic meters of recycled water recorded, demonstrating the effectiveness of the university’s water management practices.
COMMITMENT TO SUSTAINABLE PRACTICES
Overall, the university’s water reuse measurement and practices exemplify a proactive approach to sustainability. By effectively recycling wastewater and utilizing it for essential functions, the institution not only conserves valuable water resources but also sets a standard for other universities to follow.
This commitment to water reuse is crucial in addressing the challenges of water scarcity and promoting environmental stewardship within the academic community.
Total Sewage generated 23,568 and Treated Sewage 21,211 m³ per year.
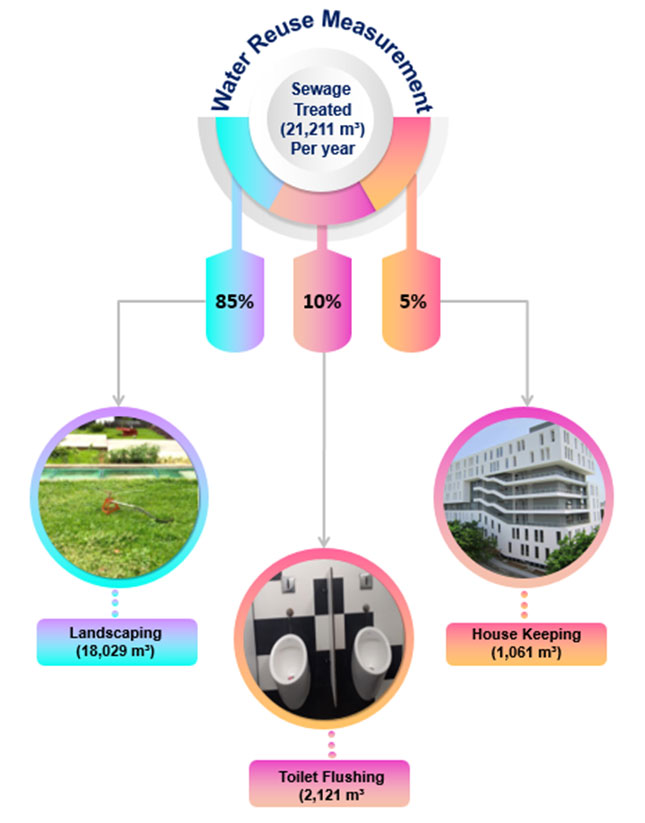
Figure VI (4.2) – 1: Water Reuse Measurement
Table VI (4.2) – 1: Water Reuse Measurement Data for the period 2022-23
| Sl. No. | Month / Year | No.of Loads | Quantity of Lorry Water before treatment m³ | Lorry Water after treatment (90%) m³ | Well Water before treatment (100%) m³ | Well Water after treatment (90% out of 5000) m³ | Total Treated Water m³ | Sewage Generated 80% m³ | Sewage Treatment 90% m³ |
| 1 | Jun-22 | 1792 | 1792 m³ | 1,613 | 269 | 242 | 1,855 | 1,484 | 1,335 |
| 2 | Jul-22 | 1459 | 1459 m³ | 1,313 | 271 | 244 | 1,557 | 1,246 | 1,121 |
| 3 | Aug-22 | 1395 | 1395 m³ | 1,256 | 266 | 239 | 1,495 | 1,196 | 1,076 |
| 4 | Sep-22 | 1646 | 1646 m³ | 1,481 | 251 | 226 | 1,707 | 1,366 | 1,229 |
| 5 | Oct-22 | 1590 | 1590 m³ | 1,431 | 278 | 250 | 1,681 | 1,345 | 1,210 |
| 6 | Nov-22 | 1685 | 1685 m³ | 1,517 | 259 | 233 | 1,750 | 1,400 | 1,260 |
| 7 | Dec-22 | 1507 | 1507 m³ | 1,356 | 250 | 225 | 1,581 | 1,265 | 1,139 |
| 8 | Jan-23 | 1422 | 1422 m³ | 1,280 | 263 | 237 | 1,517 | 1,213 | 1,092 |
| 9 | Feb-23 | 1606 | 1606 m³ | 1,445 | 253 | 228 | 1,673 | 1,339 | 1,205 |
| 10 | Mar-23 | 1855 | 1855 m³ | 1,670 | 254 | 229 | 1,899 | 1,519 | 1,367 |
| 11 | Apr-23 | 1586 | 1586 m³ | 1,427 | 272 | 245 | 1,672 | 1,338 | 1,204 |
| 12 | May-23 | 1623 | 1623 m³ | 1,461 | 274 | 247 | 1,708 | 1,366 | 1,230 |
| 13 | Jun-23 | 1324 | 1324 m³ | 1,192 | 268 | 241 | 1,433 | 1,146 | 1,031 |
| 14 | Jul-23 | 1057 | 1057 m³ | 951 | 276 | 248 | 1,199 | 959 | 863 |
| 15 | Aug-23 | 1503 | 1503 m³ | 1,353 | 252 | 227 | 1,580 | 1,264 | 1,137 |
| 16 | Sep-23 | 1274 | 1274 m³ | 1,147 | 264 | 238 | 1,385 | 1,108 | 997 |
| 17 | Oct-23 | 1194 | 1194 m³ | 1,075 | 262 | 236 | 1,311 | 1,048 | 944 |
| 18 | Nov-23 | 1247 | 1247 m³ | 1,122 | 261 | 235 | 1,357 | 1,086 | 977 |
| 19 | Dec-23 | 969 | 969 m³ | 872 | 256 | 230 | 1,102 | 882 | 794 |
| Total | 27,734 | 27,734 m³ | 24,961 | 5,000 | 4,500 | 29,461 | 23,568 | 21,212 | |
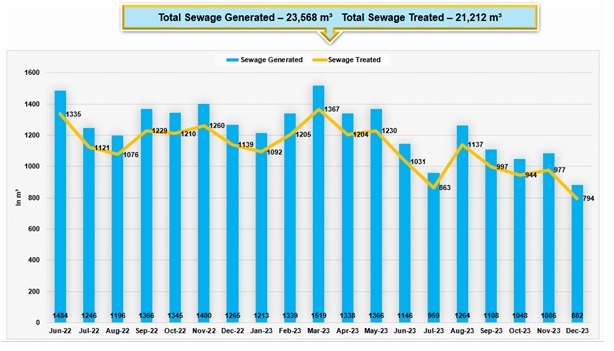
Figure VI (4.2) – 2: Month-wise Water Reuse Data
WATER TREATMENT AND SEWAGE MANAGEMENT REPORT
The following table summarizes the monthly water treatment and sewage management data from June 2022 to December 2023. It documents the quantities of lorry and well water used, the treatment processes undertaken, and the associated sewage generated and treated.
OVERVIEW OF WATER SOURCES AND TREATMENT PROCESS
- Lorry Water Treatment: Each month, lorry water was collected in various quantities, and after treatment, 90% efficiency was achieved. The data shows a monthly range of lorry water treated, with figures fluctuating from 951 m³ to 1,670 m³.
- Well Water Treatment: Collected well water, which was fully utilized initially (100%), underwent a similar treatment process at 90% efficiency. This process yielded an average collection close to 242 m³ and peaked at 278 m³ during specific months.
- Total Treated Water: The combined total of treated water from both sources shows a consistent monthly output, indicating effective resource management.
MONTHLY WATER AND SEWAGE MANAGEMENT
- Monthly data from June 2022 to December 2023 showed significant variations, with total water collected each month reflecting operational demands and treatment capacities.
- For instance, June 2022 recorded a collection of 1,792 m³ of lorry water, generating 1,484 m³ of treated water and 1,335 m³ of sewage produced. Over the period, the highest recorded sewage generation was 1,899 m³ in March 2023.
- The total treated water from all sources across the reporting period was 29,461 m³, while the total sewage generated reached 23,568 m³. Furthermore, the total sewage treated was 21,212 m³, representing a significant efficiency in sewage management.
The data reflects a proactive approach to managing both water resources and sewage treatment within the facility. The implementation of efficient treatment processes has led to substantial recycling of water, aligning with sustainability goals. Continuous monitoring and analysis of monthly figures ensure that the facility can make informed decisions regarding water usage and treatment efficacy, ultimately contributing to responsible environmental stewardship.