
B.S. Abdur Rahman Crescent Institute of Science and Technology (BSACIST) is committed to ensuring safe, affordable, and reliable access to clean water while safeguarding water quality and ecosystems. We advance wastewater treatment and pollution prevention, and promote water-conscious practices. We strengthen water reuse and measurement, and track consumption to drive efficiency. Our ongoing initiatives aim to reduce water stress, protect aquatic ecosystems, and expand safe water access, with progress demonstrated through defined metrics and regular monitoring.
Water is a vital resource for any educational institution, and tracking its consumption is essential for sustainable management. This report synthesizes data on the total volume of water used at B.S. Abdur Rahman Crescent Institute of Science and Technology, focusing on sources such as mains supply, desalinated water, and water extracted from natural sources like rivers, lakes, and aquifers.
Water Sources
The Institute relies on multiple sources for its water supply:
- Raw Water from Private Suppliers: Water is transported via tanker lorries from various sources, including rivers, lakes, and aquifers. The total volume of water received from this source during the period of 2023-24 was 17,795 m³.
- University Wells: The Institute has three bore wells and three open wells, which collectively extract approximately 3,157 m³ of water annually. This water is regularly tested to ensure it meets drinking water standards.
- Treated Water: The campus is equipped with five water treatment plants that process water for use in toilets, hostels, and staff quarters. The treatment process ensures that the water is safe for various uses.
Water Consumption Data
The total water consumption for the academic year 2023-24 is detailed in Table VI-2. The breakdown of water consumption by different categories is as follows:
- Faculty: 610 faculty members consumed approximately 5 m³ of water daily.
- Staff: 225 staff members used about 2 m³ daily.
- Students:
- Day scholars (7,485 students) consumed around 58 m³ daily.
- Men’s hostel (1,863 students) accounted for 14 m³ daily.
- Women’s hostel (539 students) used about 4 m³ daily.
- Staff Quarters: 400 residents consumed approximately 3 m³ daily.
- Estate Office: 350 staff members used about 3 m³ daily.
- Kitchen & Canteen: 50 individuals consumed around 0.39 m³ daily.
- General Workers: 280 workers used about 2 m³ daily.
The total number of persons in the Institute is 11,802, leading to an overall water consumption of 92 m³ per day, which translates to 24,05,600 m³ annually.
Summary of Water Treatment
The treatment of water is crucial for ensuring safety and sustainability. The data indicates that the water treatment plants effectively process both lorry water and well water. For instance, in January 2024, 1,143 m³ of lorry water was treated, resulting in 1,039 m³ of usable water. Similarly, well water treatment yielded significant volumes, contributing to the overall water supply.
The B.S. Abdur Rahman Crescent Institute of Science and Technology demonstrates a comprehensive approach to water management, utilizing multiple sources and ensuring quality through regular testing and treatment. The total volume of water consumed reflects the institution’s commitment to sustainability and responsible resource management. Continuous monitoring and improvement of water usage practices will be essential for future sustainability efforts.
B. WATER SOURCES AND CONSUMPTION
The main source of water supply for the Institute includes,
I. RAW WATER FROM PRIVATE SUPPLIERS (EXTRACTED FROM RIVERS, LAKES AND AQUIFERS):
The water is transported to the Institute by means of Tanker Lorries. Two new water lorries were purchased at a total cost of Rs. 48 lakhs.
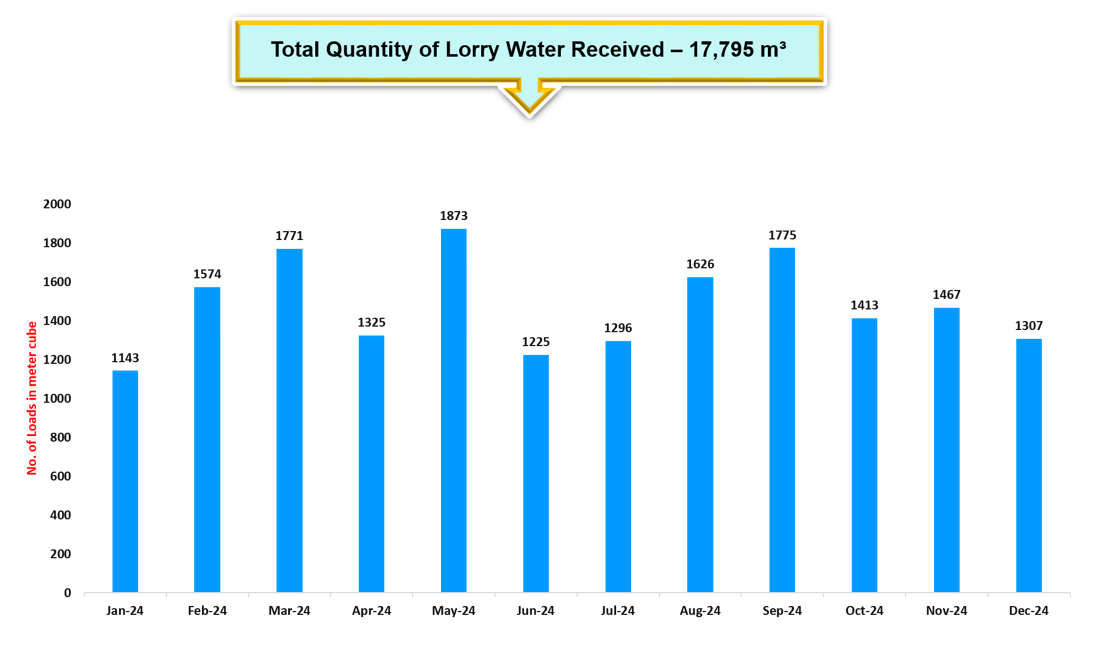
Figure VI (2.1) – 1: The total number of loads for the period 2023-24
II. UNIVERSITY – OPEN WELL & BORE WELLS:
The water required is also met by extracting the water from the bore wells (3 Nos) and open wells (3 Nos) facility available in the Institute. The Annual Extraction of Water is 3,157 m3 per year. The Institute also ensures that the quality of water obtained from the private supply and also from the well meets the drinking water standards by frequently conducting the water quality test.
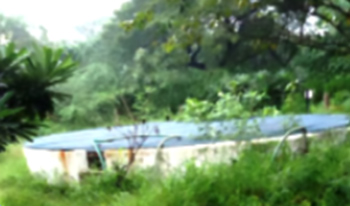
Figure VI (2.1) – 2: Water extraction from Open wells
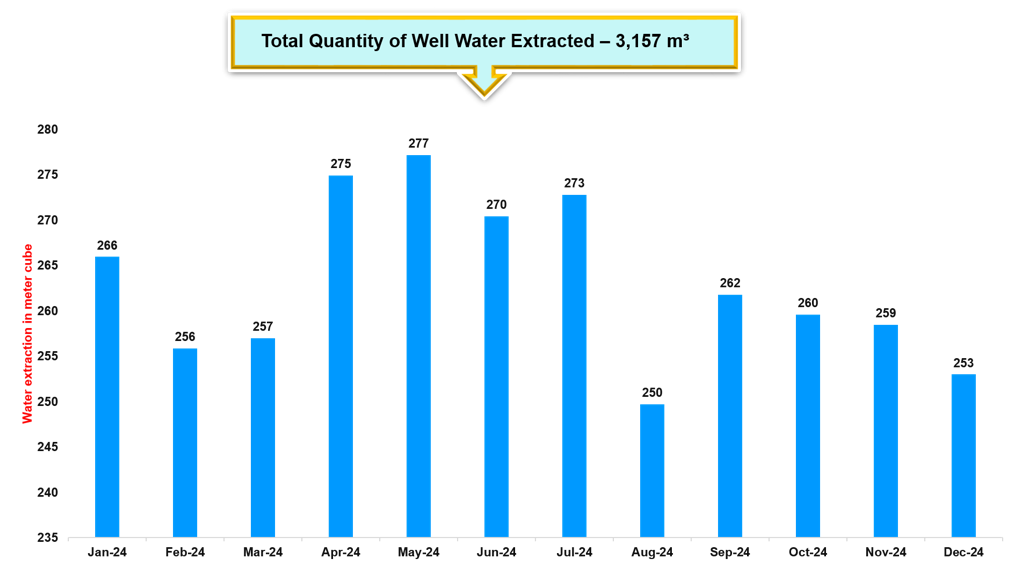
Figure VI (2.1) – 3: Water extraction from Open wells for the period 2023-24
B.S. Abdur Rahman Crescent Institute of Science and Technology measures the total volume of water used in the Institution.
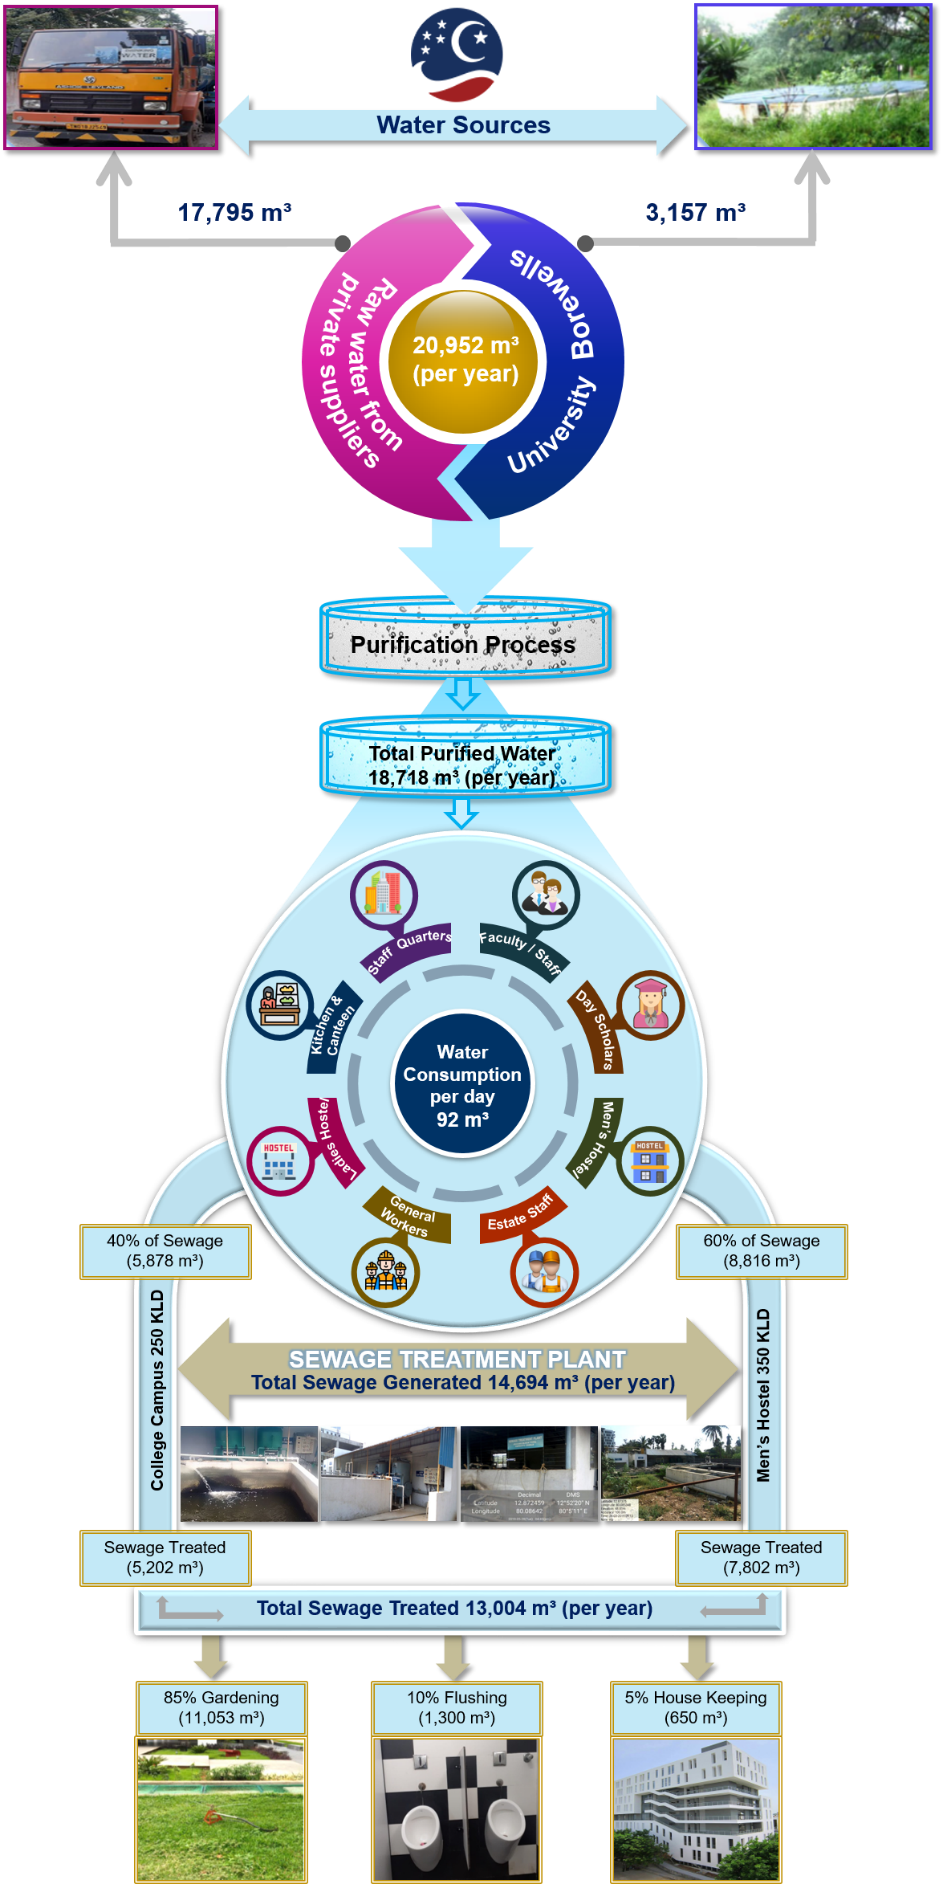
Figure VI (2.1) – 4: Schematic representation for Total volume of Water from Sources / Purified / Consumed, treated (Recycle) and Reuse statistics
The diagram outlines the water management system implemented at the B.S. Abdur Rahman Crescent Institute of Science and Technology, highlighting sources, purification processes, consumption, and sewage treatment.
DESCRIPTION OF THE DIAGRAM (Figure VI – 4):
- Water Sources
- Raw Water Supply: The diagram indicates two primary sources of water, with a total annual supply of 20,952 cubic meters (m³). This is comprised of 17,795 m³ purchased from private suppliers and 3,157 m³ sourced from university wells.
- Purification Process
- Total Purified Water: After purification, the total volume of clean, usable water produced amounts to 18,718 m³ per year. This illustrates the effectiveness of the purification system in making water available for various uses.
- Daily Water Consumption
- Water Usage Breakdown: The diagram provides a snapshot of daily water consumption, which averages 92 m³. Consumption is categorized into different sectors:
- Staff quarters
- Day scholars
- Hostels
- Kitchens and general workers
- Faculty staff and estate staff
- Sewage Generation and Treatment
- Sewage Treatment Plant: The institute generates a total of 14,694 m³ of sewage per year, of which 40% (approximately 5,878 m³) and 60% (approximately 8,816 m³) are treated. The sewage treatment plant (STP) has a capacity of 600 kiloliters per day (KLD).
- Total Sewage Treated: Out of the generated sewage, 13,005 m³ is treated, with distributions as follows:
- ~ 85% for Gardening: 11,053 m³ is reused for landscaping and gardening purposes.
- ~ 10% for Flushing: 1,300 m³ is allocated for toilet flushing.
- ~ 5% for Housekeeping: 650 m³ is used for housekeeping activities.
This diagram effectively illustrates the comprehensive water management strategy at BSACIST, detailing water sources, purification processes, daily consumption, and sewage treatment practices. It emphasizes the institute’s commitment to sustainability through efficient water usage and recycling efforts, showcasing how various sectors of the campus contribute to water conservation.
III. TREATED WATER:
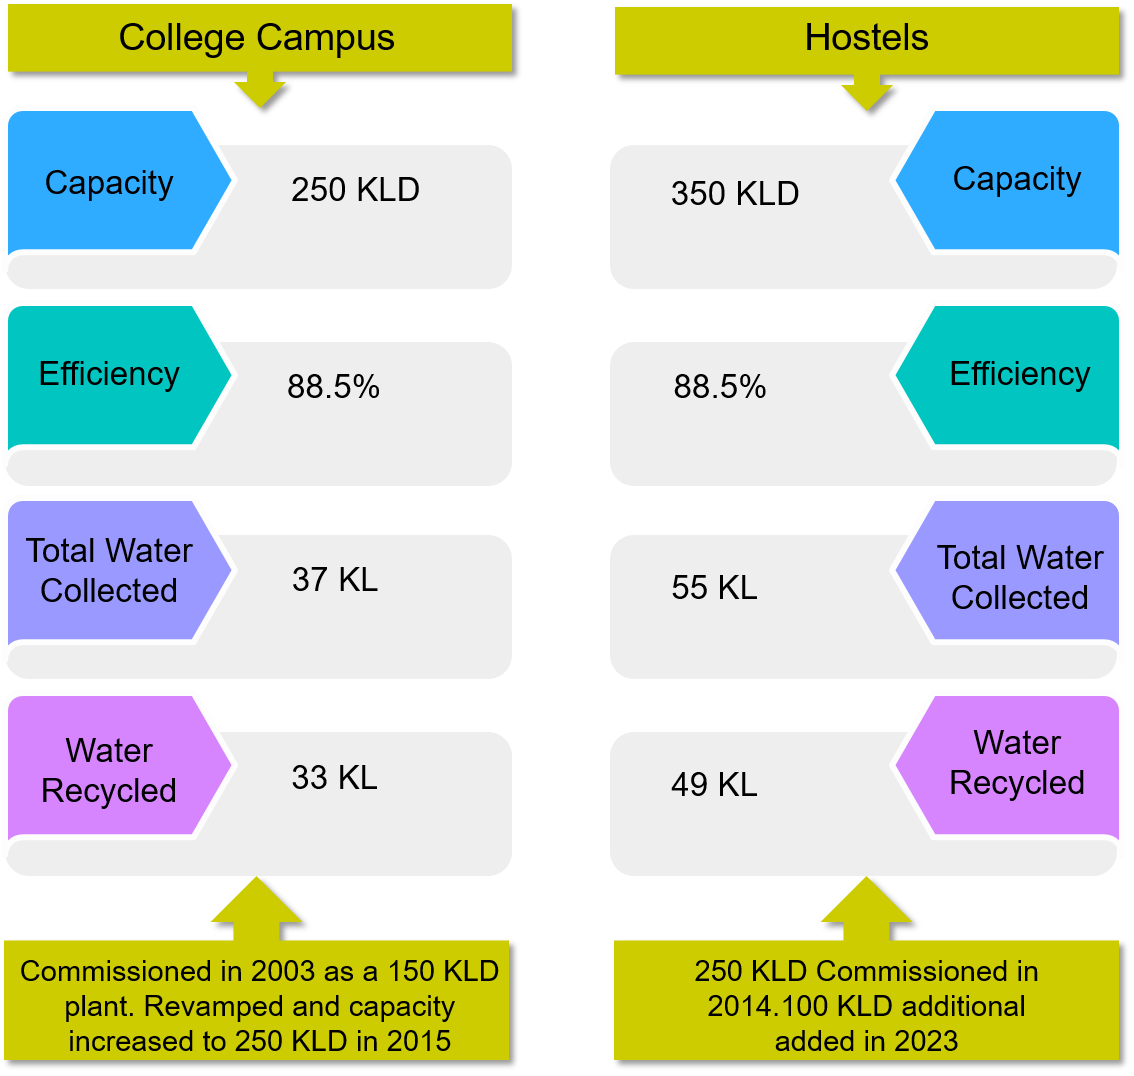
Figure VI (2.1) – 5: Details of Sewage Treatment Plants
DESCRIPTION OF THE DIAGRAM (Figure VI – 5):
1. College Campus
- Capacity: The sewage treatment plant has a capacity of 250 kiloliters per day (KLD).
- Efficiency: The system operates at an efficiency rate of 88.5%, indicating effective treatment and utilization of water resources.
- Total Water Collected: A total of 37 kiloliters (KL)of water is collected for treatment.
- Water Recycled: Out of the collected water, 33 KLis recycled, showcasing a high rate of resource recovery.
- Commissioning Information: The plant was originally commissioned in 2003as a 150 KLD facility and underwent renovations in 2015, increasing its capacity to 250 KLD.
2. Hostels
- Capacity: The hostel’s sewage treatment facility has a capacity of 350 KLD, which provides sufficient treatment for the needs of the hostel residents.
- Efficiency: Similar to the campus, this system also operates at 88.5% efficiency.
- Total Water Collected: The hostel collects a total of 55 KLof water for treatment.
- Water Recycled: From the collected water, 49 KLis recycled, indicating a strong commitment to sustainable water use.
- Commissioning Information: The hostel’s sewage treatment plant was commissioned in 2014as a 250 KLD facility, with an additional 100 KLD added in 2023 to enhance capacity and meet growing demand.
Overall, the diagram illustrates the effective water management systems in place at the College Campus and Hostels of BSACIST. Both systems demonstrate efficient operation, significant water recycling, and a commitment to enhancing infrastructure over time. The comparisons highlight how the university prioritizes sustainable practices in water management to support its growing community.
Table VI (2.1) – 1: Water Data for the period 2023-24
Sl. No. | Month / Year | No. of Loads | Quantity of Lorry Water before treatment (m³) | Lorry Water after treatment (m³) | Well Water before treatment (m³) | Well Water after treatment (m³) | Total Treated Water (m³) | Sewage Generated (m³) | Sewage Treatment (m³) |
1 | Jan-24 | 1143 | 1143 m³ | 1039 | 266 | 242 | 1281 | 1012 | 901 |
2 | Feb-24 | 1574 | 1574 m³ | 1402 | 256 | 233 | 1635 | 1292 | 1150 |
3 | Mar-24 | 1771 | 1771 m³ | 1578 | 257 | 234 | 1812 | 1431 | 1274 |
4 | Apr-24 | 1325 | 1325 m³ | 1181 | 275 | 250 | 1431 | 1130 | 1006 |
5 | May-24 | 1873 | 1873 m³ | 1669 | 277 | 252 | 1921 | 1518 | 1351 |
6 | Jun-24 | 1225 | 1225 m³ | 1091 | 270 | 246 | 1338 | 1057 | 940 |
7 | Jul-24 | 1296 | 1296 m³ | 1155 | 273 | 243 | 1398 | 1090 | 959 |
8 | Aug-24 | 1626 | 1626 m³ | 1449 | 250 | 222 | 1671 | 1303 | 1147 |
9 | Sep-24 | 1775 | 1775 m³ | 1582 | 262 | 233 | 1815 | 1415 | 1245 |
10 | Oct-24 | 1413 | 1413 m³ | 1259 | 260 | 231 | 1490 | 1162 | 1023 |
11 | Nov-24 | 1467 | 1467 m³ | 1307 | 259 | 230 | 1537 | 1199 | 1055 |
12 | Dec-24 | 1307 | 1307 m³ | 1165 | 253 | 225 | 1390 | 1084 | 954 |
Total | 17,795 | 17,795 m³ | 15,876 | 3,157 | 2,842 | 18,718 | 14,694 | 13,005 | |
C. Water Treatment and Sewage Management Report
The following table summarizes the monthly water treatment and sewage management data from January 2024 to December 2024. It documents the quantities of lorry and well water used, the treatment processes undertaken, and the associated sewage generated and treated.
Overview of Water Sources and Treatment Process
- Lorry Water Treatment: Each month, lorry water was collected in various quantities, and after treatment, 90% efficiency was achieved. The data shows a monthly range of lorry water treated, with figures fluctuating from 1039 m³ to 1,669 m³.
- Well Water Treatment: Collected well water, which was fully utilized initially (100%), underwent a similar treatment process at 90% efficiency. This process yielded an average collection close to 222 m³ and peaked at 252 m³ during specific months.
- Total Treated Water: The combined total of treated water from both sources shows a consistent monthly output, indicating effective resource management.
Monthly Water and Sewage Management
- Monthly data from January 2024 to December 2024 showed significant variations, with total water collected each month reflecting operational demands and treatment capacities.
- For instance, January 2024 recorded a collection of 1,039 m³ of lorry water and 242 m³ of well water, generating of sewage 1,012 m³ and 901 m³ of sewage treated. Over the period, the highest recorded sewage generation was 1,518 m³ in May 2024.
- The total treated water from all sources across the reporting period was 18,718 m³, while the total sewage generated reached 14,694 m³. Furthermore, the total sewage treated was 13,005 m³, representing a significant efficiency in sewage management.
The data reflects a proactive approach to managing both water resources and sewage treatment within the facility. The implementation of efficient treatment processes has led to substantial recycling of water, aligning with sustainability goals. Continuous monitoring and analysis of monthly figures ensure that the facility can make informed decisions regarding water usage and treatment efficacy, ultimately contributing to responsible environmental stewardship.
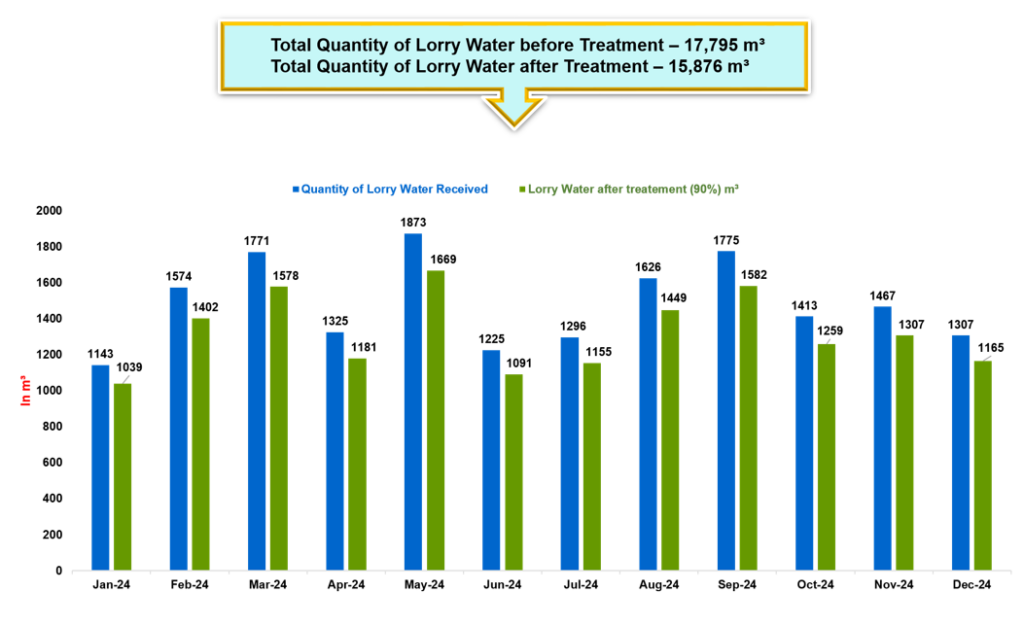
Figure VI (2.1) – 6: Lorry Water before and after Treatment in m³
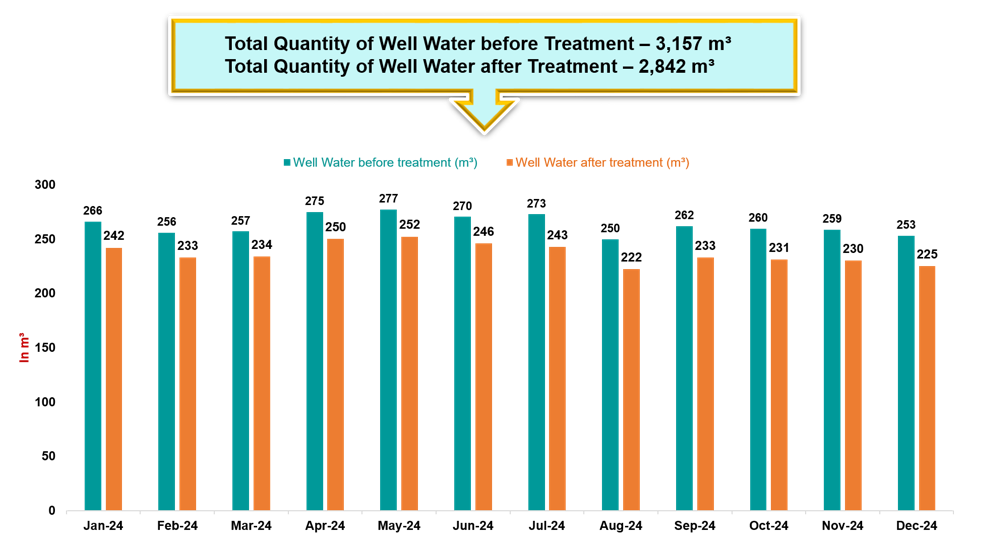
Figure VI (2.1) – 7: Well Water Before and after Treatment in m³
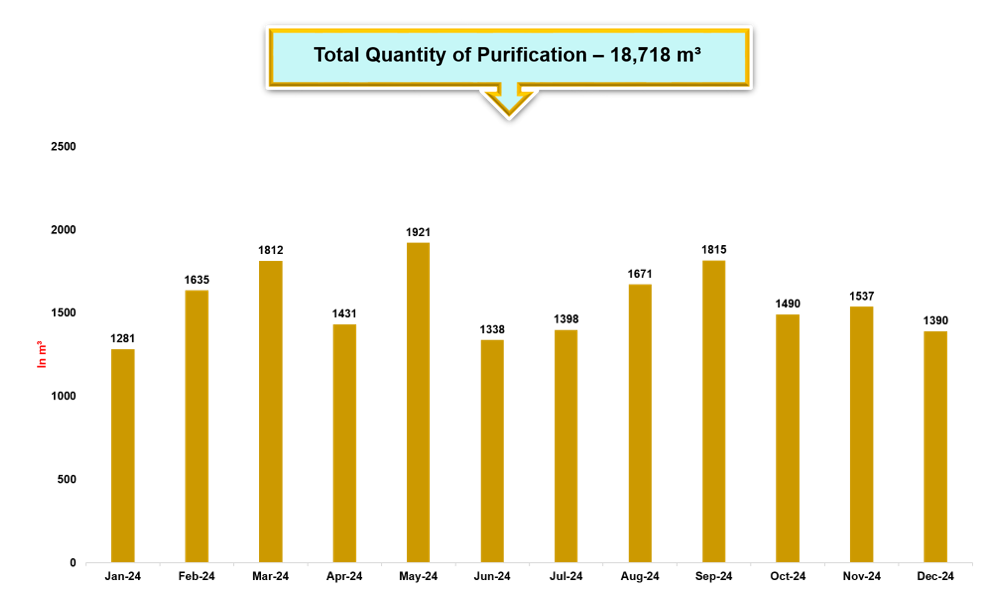
Figure VI (2.1) – 8: Water Purification Data for the year 2023-24 in m³
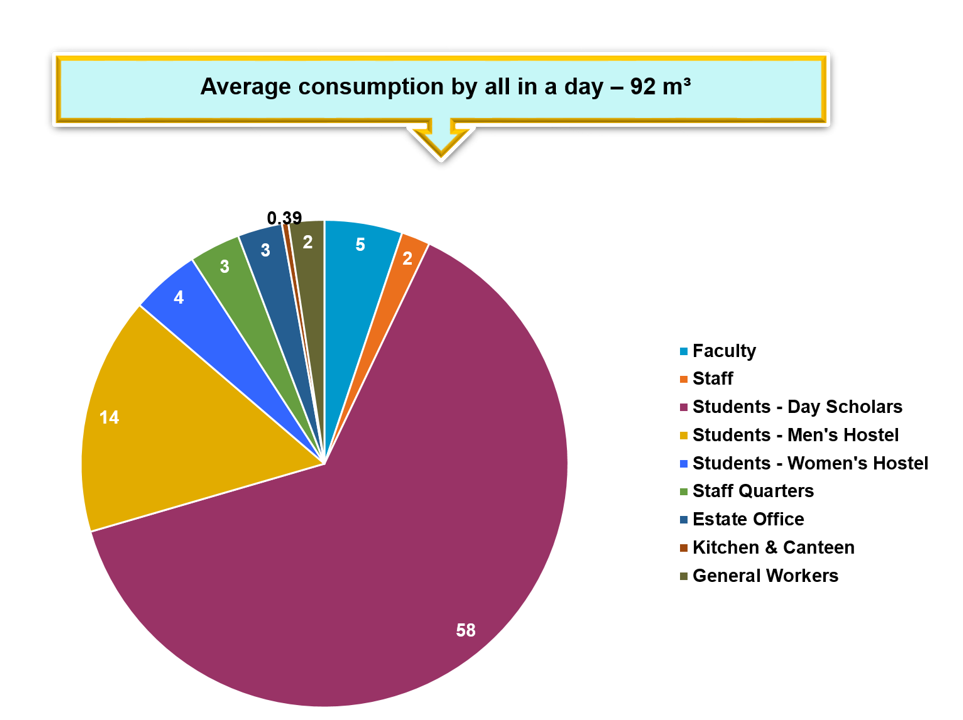
Figure VI (2.1) – 9: Water Consumption : FTE / per day in m³
Table VI (2.1) – 2: Water Consumption Data 2023-24
S. No | Details | No. of persons | No. of days per year | Persons X days | Water consumed by |
1 | Faculty | 610 | 180 | 109800 | 5 |
2 | Staff | 225 | 180 | 40500 | 2 |
3 | Students – Day Scholars | 7485 | 180 | 1347300 | 58 |
4 | Students – Men’s Hostel | 1863 | 250 | 465750 | 14 |
5 | Students – Women’s Hostel | 539 | 250 | 134750 | 4 |
6 | Staff Quarters | 400 | 300 | 120000 | 3 |
7 | Estate Office | 350 | 300 | 105000 | 3 |
8 | Kitchen & Canteen | 50 | 250 | 12500 | 0.39 |
9 | General Workers | 280 | 250 | 70000 | 2 |
Total | 11802 | 2140 | 2405600 | 92 |
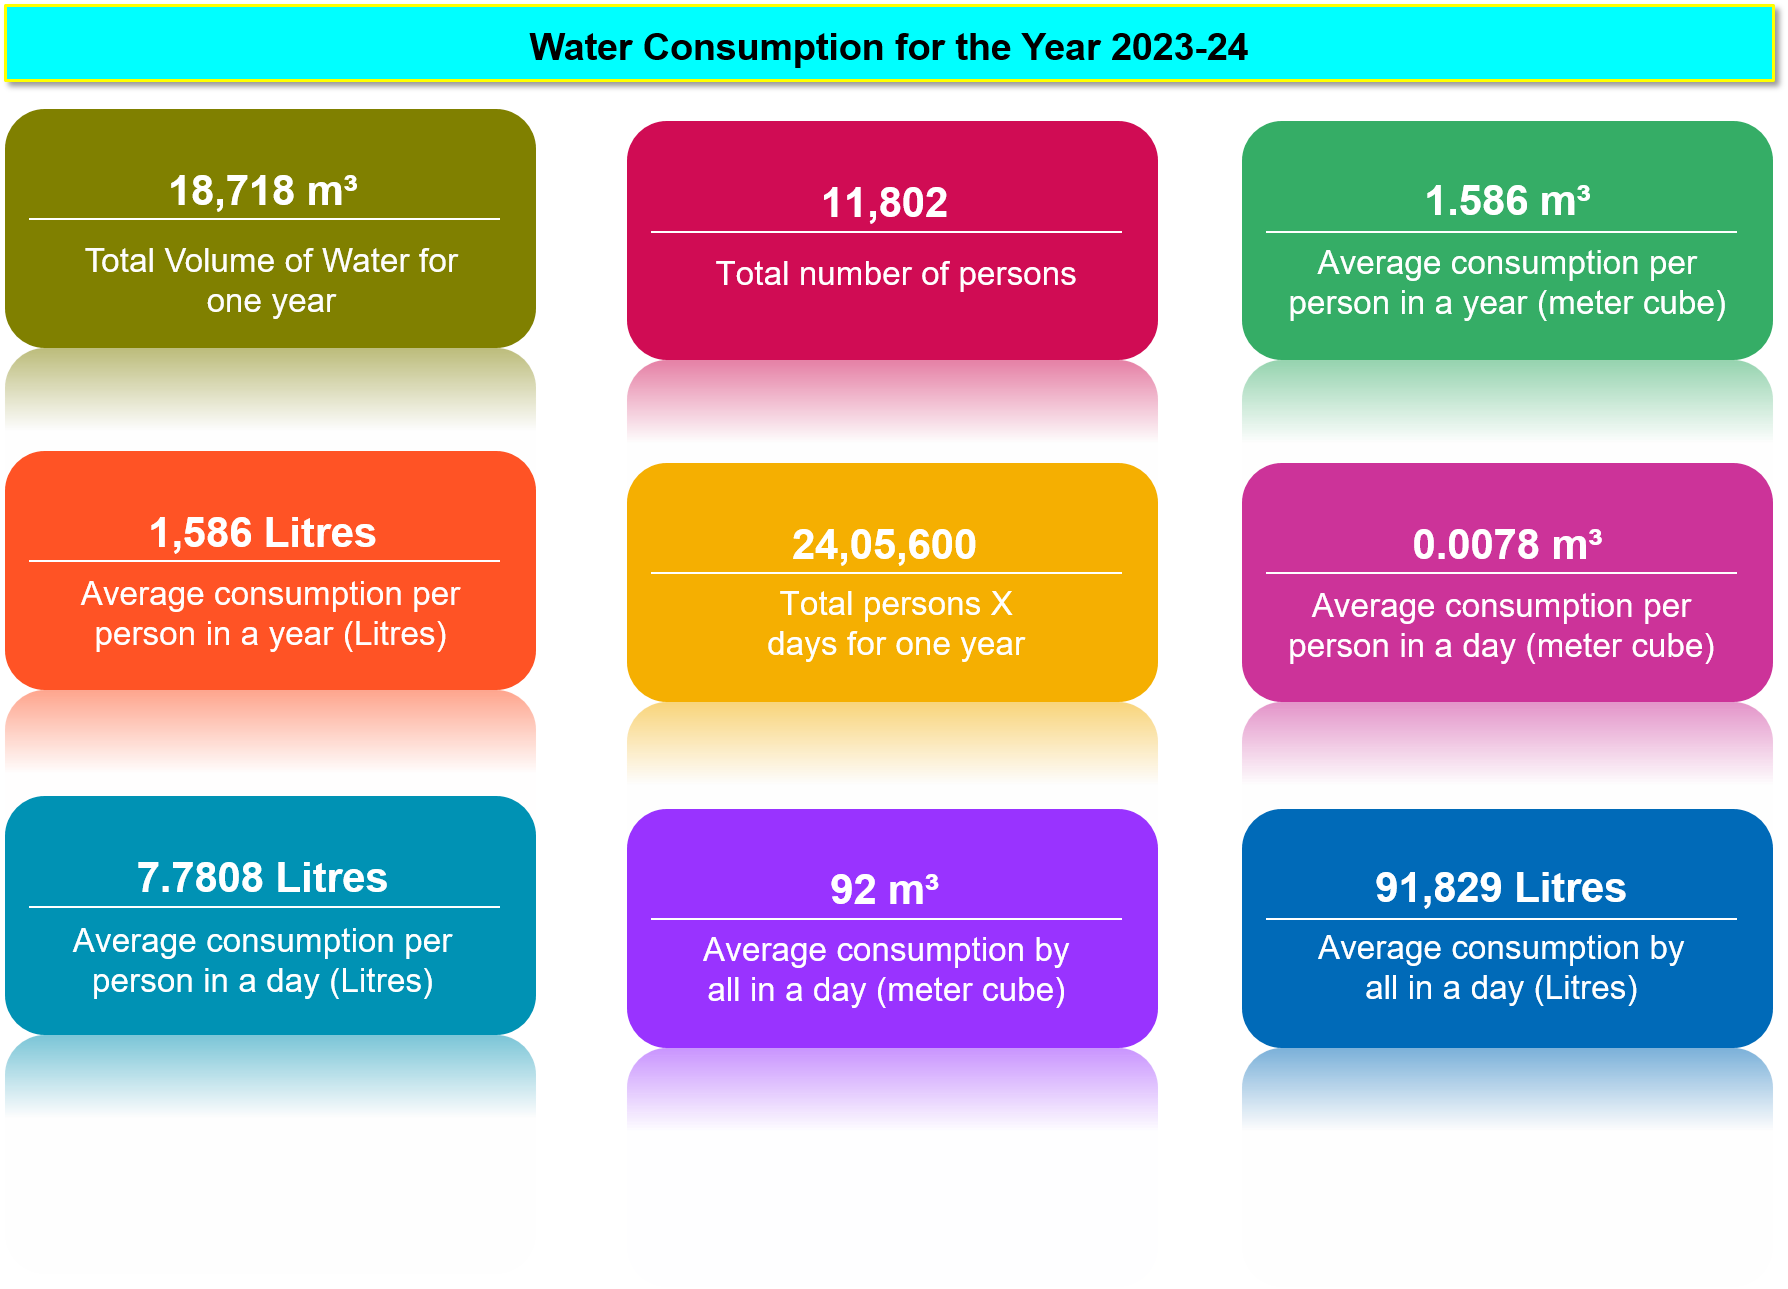
Figure VI (2.1) – 10: Average Water Consumption
D. WATER CONSUMPTION OVERVIEW FOR THE YEAR 2023-24
This infographic provides a clear representation of water consumption metrics for the year 2023-24 at B.S. Abdur Rahman Crescent Institute of Science and Technology.
1. Total Water Volume
- 18,718 m³: This figure indicates the total volume of water consumed throughout the year, emphasizing the scale of water management efforts within the institution.
2. Population Served
- 11,802 : This number reflects the total number of individuals utilizing the water resources, which may include students, staff, and faculty.
3. Average Annual Consumption
- 1,586 Litres : On average, each person consumed approximately 2,405 litres of water over the course of a year, highlighting individual usage patterns concerning water resources.
4. Total Consumption Calculation
- 24,05,600 : This total is derived from multiplying the number of persons by the total days in a year, demonstrating the comprehensive engagement of the population with water consumption.
5. Daily Consumption Insights
- Average Daily Consumption:
- 7.78 Litres: This metric indicates the average daily water consumption per person, allowing for an understanding of daily water usage habits.
- 92 m³: The total average consumption for all users in a day is represented in cubic meters, providing a broader perspective on daily water demand.
6. Micro Consumption Metrics
- 0.0078 m³: This figure translates the average daily consumption per person into cubic meters, underscoring the granularity of water usage data, which is important for detailed management and planning.
- 91,829 Litres: This shows the aggregated total of daily water consumption by all individuals, structured in litres for precision in resource planning and assessment.
Overall, these metrics illustrate a structured approach to monitoring and managing water consumption within the institution. With clear indicators of individual and collective usage, the data supports ongoing efforts to promote sustainability and responsible water management practices. This analysis equips decision-makers with insightful information that can enhance future water conservation strategies and policies.
Water Management and Reuse Policy
Issue: 04; Revised on 2023
| Policy Created on | July 2009 |
| 1st Revision amended on | IQAC Meeting held on 27th October 2017 |
| 2nd Revision amended on | IQAC Meeting held on 31st March 2021 |
| 3rd Revision amended on | IQAC Meeting held on 16th June 2023 |
Responsible Executive : Director (IQAC)
Responsible Office : Internal Quality Assurance Cell,
Student Affairs, Estate Office, Academic Office, Library and SDG Cell
Contacts : Registrar and Director (IQAC)
6.1 STATEMENT OF POLICY
The B.S. Abdur Rahman Crescent Institute of Science and Technology is committed to achieving the following objectives in alignment with Sustainable Development Goal 6 (SDG 6) – Clean Water and Sanitation:
a) Ensure universal and equitable access to safe and affordable drinking water for all stakeholders.
b) Provide adequate and equitable sanitation and hygiene for all, with special attention to the needs of women, girls, and vulnerable groups.
c) Improve water quality by reducing pollution, eliminating dumping, and minimizing the release of hazardous chemicals and materials.
d) Halve the proportion of untreated wastewater and substantially increase recycling and safe reuse globally.
e) Substantially increase water-use efficiency across all sectors and ensure sustainable withdrawals and freshwater supply to address water scarcity.
f) Implement integrated water resources management at all levels, including transboundary cooperation as appropriate.
g) Protect and restore water-related ecosystems, including mountains, forests, wetlands, rivers, aquifers, and lakes.
h) Expand international cooperation and capacity-building support to developing countries in water- and sanitation-related activities and programs.
i) Support and strengthen the participation of local communities in improving water and sanitation management.
6.2 REASON FOR THIS POLICY
The policy aims to provide all stakeholders with adequate water supply, sanitation, and hygiene. It emphasises maximising the collection and treatment of sewage generated and the reuse of treated wastewater sustainably, thereby reducing dependency on freshwater resources. The policy promotes treating wastewater as an economic resource.
6.3 RESPONSIBILITIES
6.3.1 Policy Principles
a) The campus shall provide adequate water supply and maximize water reuse by adhering to the following principles:
- Equitable access to safe and affordable drinking water for all stakeholders.
- Access to adequate sanitation and hygiene, ending open defecation, with special attention to vulnerable groups.
- Calculation of water usage per person (students, staff, and faculty) annually.
- Improving water quality by reducing pollution and increasing recycling and safe reuse.
- Utilization of recycled/treated wastewater for beneficial purposes, such as irrigation and toilet flushing.
- Implementation of integrated water resources management at all levels.
- Protection and restoration of water-related ecosystems on campus.
- Expansion of rainwater harvesting initiatives.
- Collaboration with government, NGOs, and industries in water-related activities.
- Support for student and staff participation in water management.
6.4.1 Water Reuse Policy Objectives
- Establish a comprehensive policy to maximize water reuse across the university.
- Ensure that all new buildings adhere to water-conscious building standards that facilitate water reuse.
- Implement systems for tracking and measuring water consumption and reuse.
6.4.2 Water Reuse
- Water Reuse Policy: maximise water reuse across the university.
- Water Reuse Measurement: Measure water reuse across the university.
6.5 DISSEMINATION OF POLICY
a) Display signage promoting water use efficiency across the campus.
b) Conduct awareness programs at regular intervals to increase water-use efficiency.
c) Post the policy on the Institute’s website and update it as necessary.
6.6 ENFORCEMENT OF POLICY
a) The Director (Planning & Development) and Deputy Director monitor compliance and address breaches.
b) Awareness of the policy among students, staff, and visitors is essential.
c) Breaches may lead to disciplinary action as per the Institute’s code of conduct.